
Spatial intelligence for better decisions.
See Where Action Matters Most.
RADS uses geospatial analysis to help organizations understand where problems are concentrated, how conditions vary across places, and where action is needed most.
From mapping and remote sensing to population estimation, climate risk and spatial modelling, we combine data, analytical methods and geographic context to turn complex spatial information into practical insight.
This fits RADS’ broader positioning around local intelligence and the idea that “where a problem exists can be as important as how large it is.”
GIS Mapping, Cartography & Map Production
We turn geographic data into clear, decision-ready maps that reveal patterns, differences and relationships across locations.
Population and Built-Environment Catchments of DKT Clinics, Karachi
500 m catchments around 63 DKT provider clinics are split into NE/SE/SW/NW quadrants and cut where neighbouring circles meet so nothing is counted twice. Each catchment is profiled with buildings, points of interest, and 2023 population (total, women of reproductive age, under-1/2/5 by sex).
- 63 providers became 57 non-overlapping catchments in five Karachi districts (Malir 27, East 15, Korangi 12, West 6, Central 3 providers).
- 197,794 buildings and 2,544 OSM points of interest were mapped.
- About 1.06M people fall in the catchments, including about 170K MWRA and about 143K children under 5. The largest single catchment holds about 69.7K people.
Remote Sensing, NDVI & AOD Analysis
We use satellite and earth-observation data to understand environmental conditions and how they change across space and time.
Orangi Town NDVI & AOD Time Series Viewer
An interactive viewer comparing vegetation cover (NDVI) and aerosol load (AOD) across Orangi Town, Karachi, from 2013 to 2026. AOD is a proxy for particulate pollution, not a direct PM2.5 measurement.
- 13-year NDVI record (2013-2026): annual vegetation stills derived from Landsat 8/9 surface reflectance at 30 m resolution.
- 12-year AOD record (2013-2025): annual aerosol stills derived from MODIS MAIAC (MCD19A2) at 1 km resolution.
- AOD data are not available for 2026.
Spatial Data Analysis
We analyse spatial patterns to identify geographic concentrations, inequalities, clusters and areas requiring attention.
Dhoke Hassu Spatial Explorer
The Dhoke Hassu Spatial Explorer brings together multiple layers of local spatial information in one interactive map. It allows users to explore building footprints, key sites, points of interest and commercial activity, residential and commercial areas, union council boundaries, and road networks.
- Buildings & Key Sites — Spatial distribution of structures and important locations
- POIs & Commercial Activity — Explore points of interest and commercial areas
- Residential vs Commercial — Compare land-use patterns across the area
- Union Councils & Roads — View administrative boundaries and transport networks
Disaster Risk Reduction, Flood Forecasting & Climate Risk
We use spatial data to identify hazard exposure, assess climate-related risks and support preparedness and response planning.
Project title
Add featured project description here.
Socioeconomic & Health Analysis
We analyse health and socioeconomic indicators at district level to show where outcomes and disadvantages are concentrated.
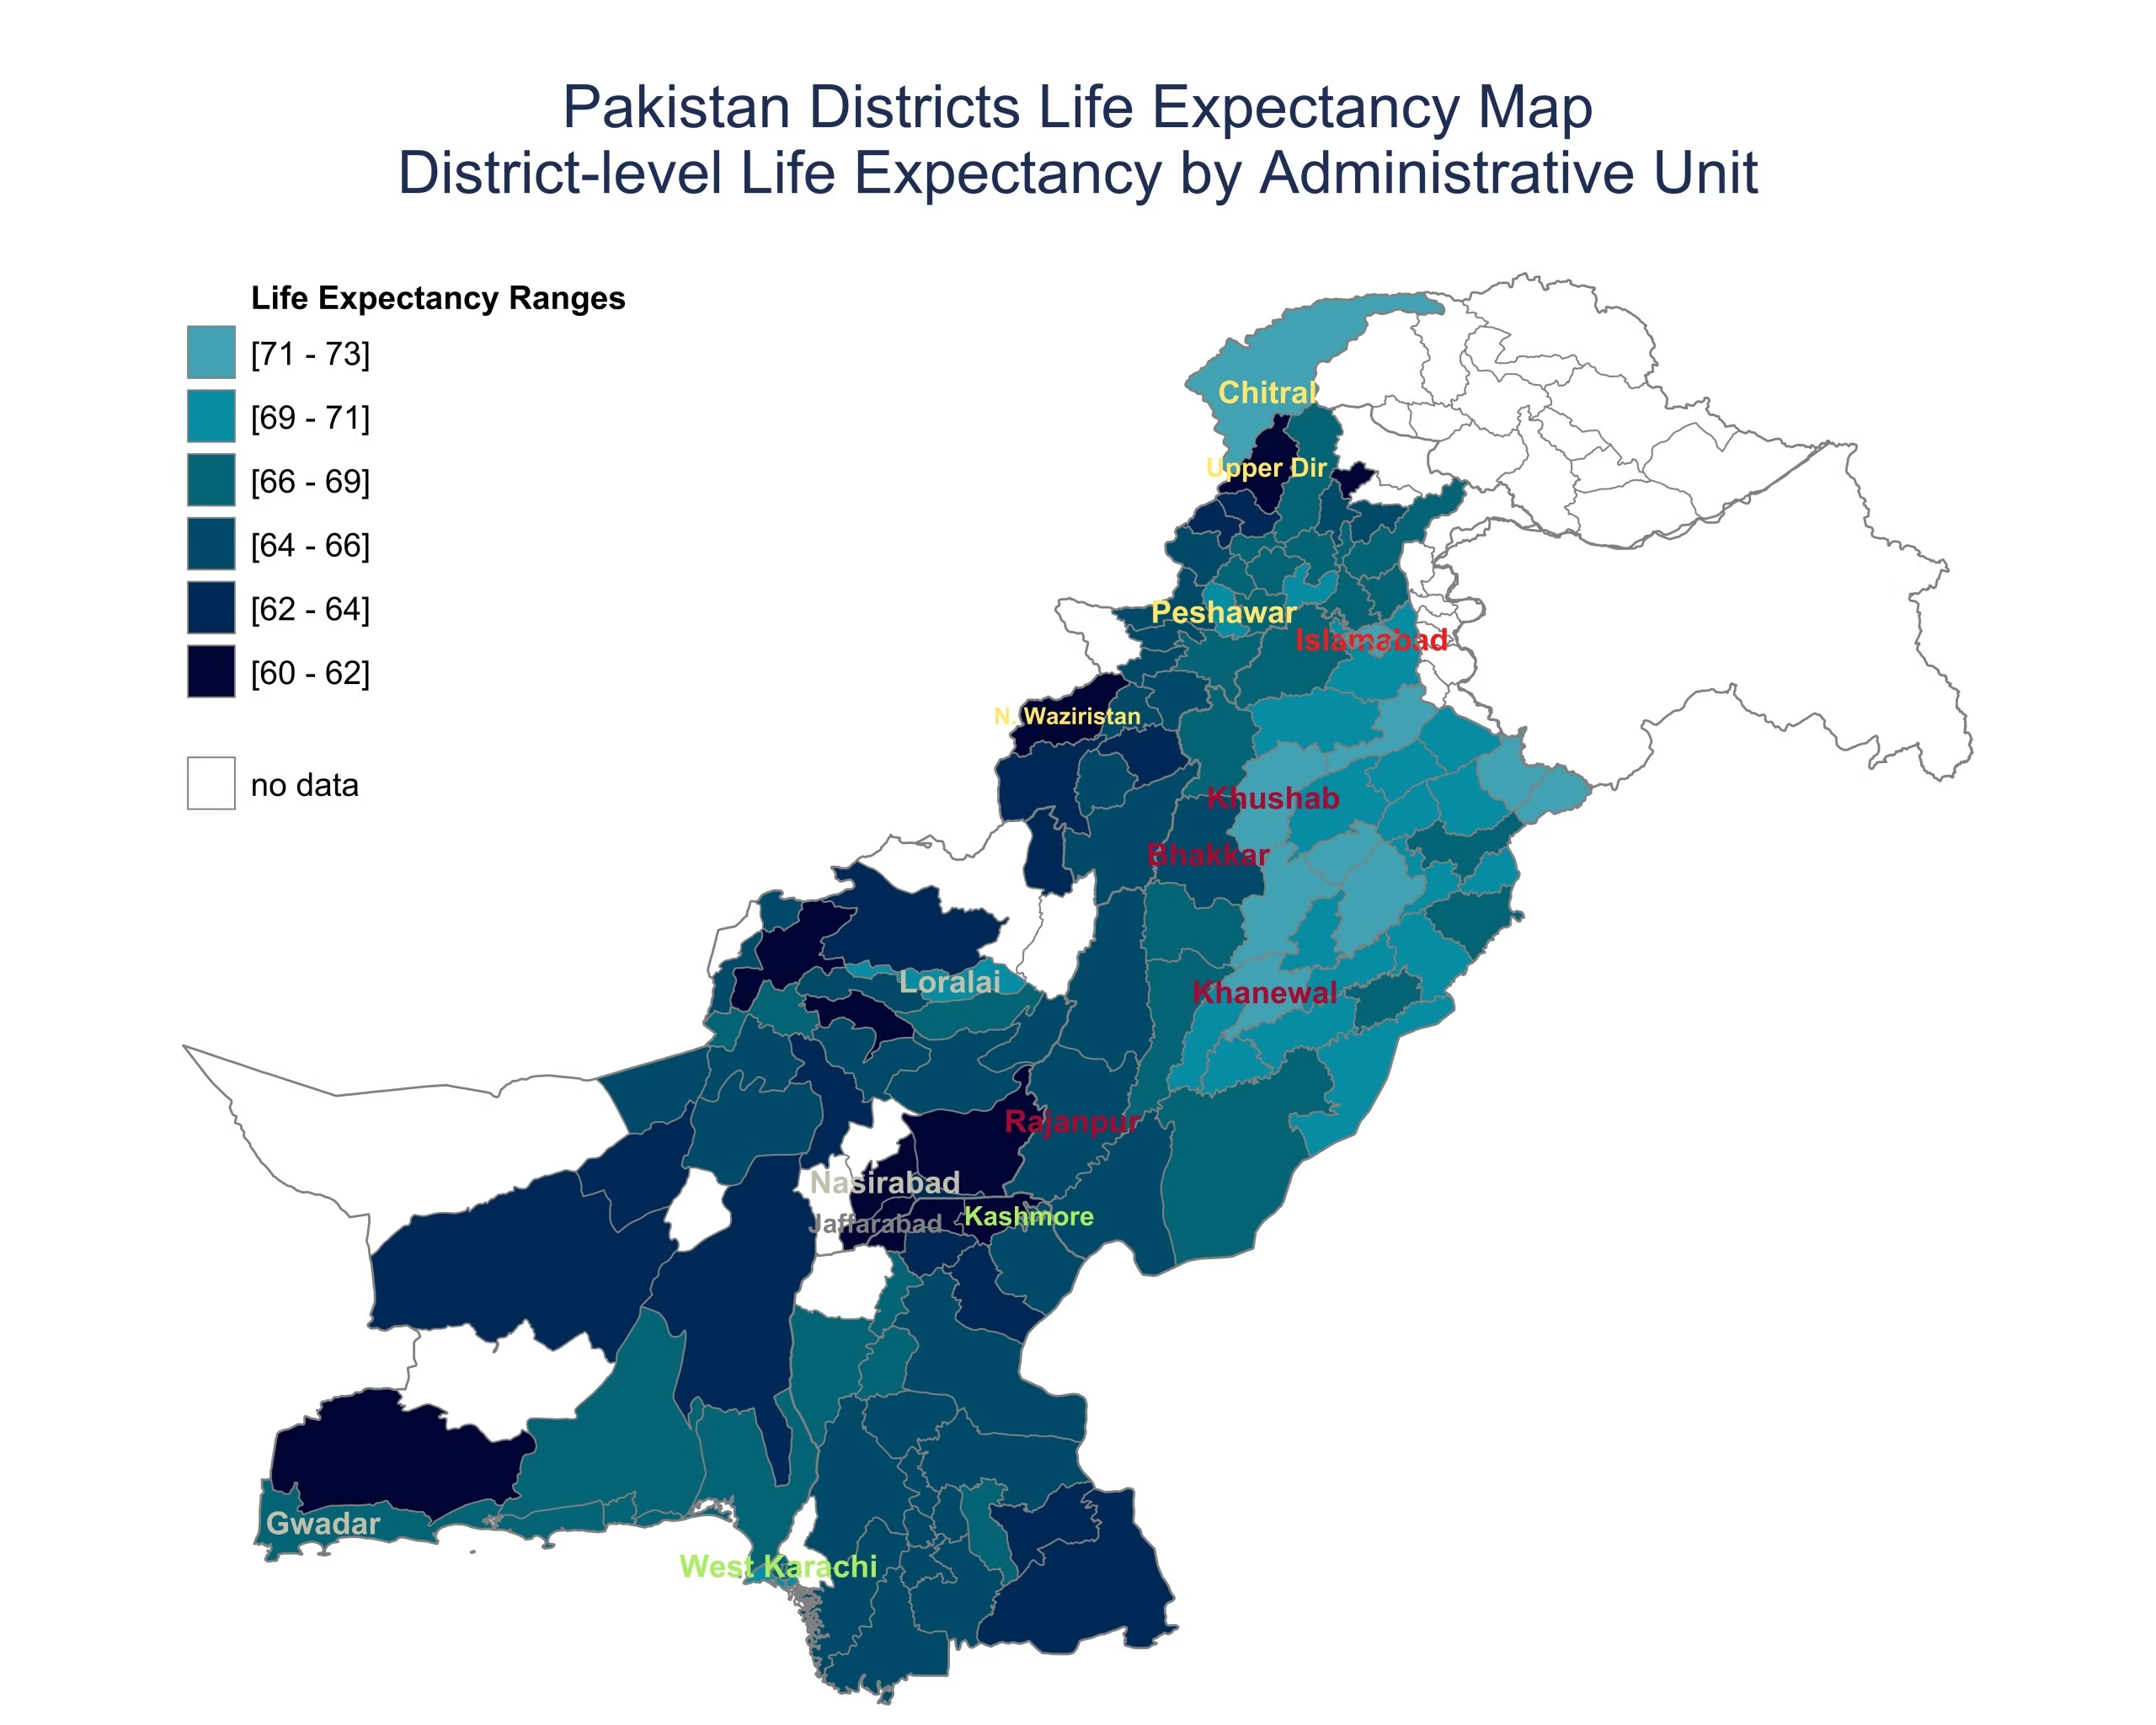
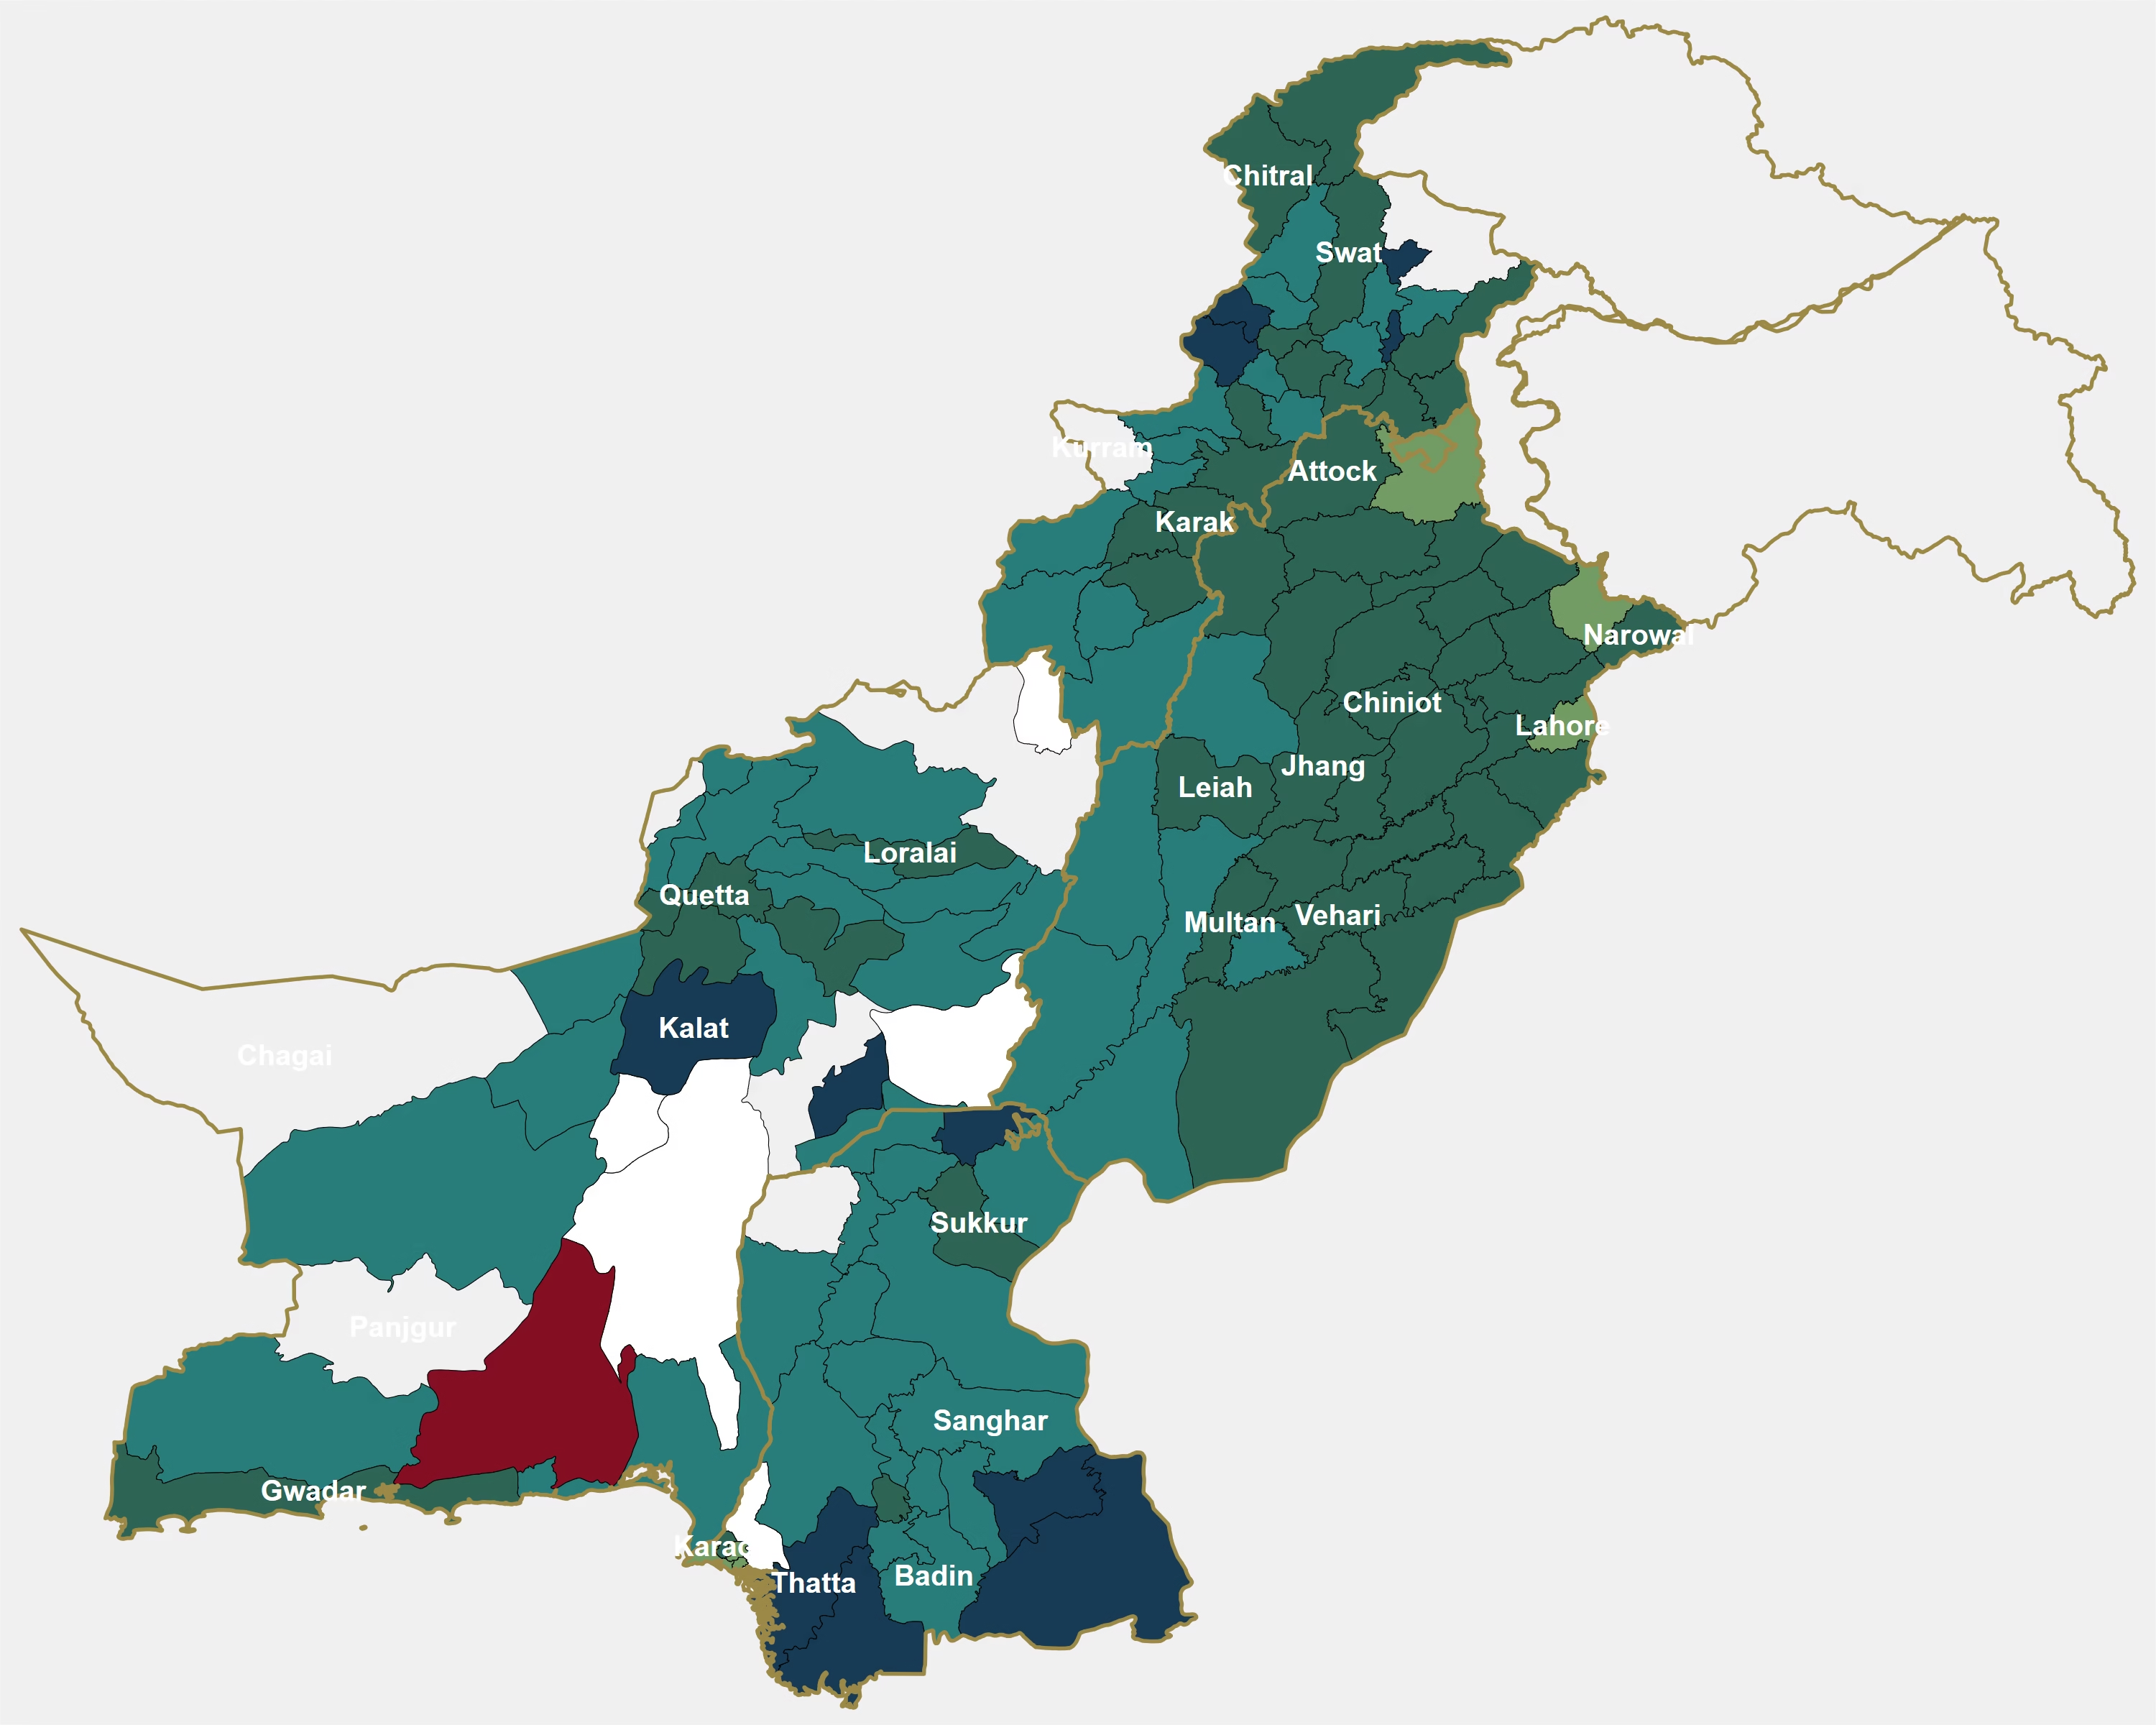
District-Level Life Expectancy in Pakistan
A district-level map showing estimated life expectancy at birth across Pakistan. The map highlights geographic differences in how long people are expected to live, revealing inequalities that national and provincial averages can conceal.
- Life expectancy ranges from approximately 60 to 73 years across districts, representing a gap of up to 13 years.
- Chitral (72.9 years) and Khanewal (72.0 years) are among the highest, while Jaffarabad (60.0 years), Kashmore (60.7 years) and Upper Dir (60.7 years) are among the lowest.
- Methodology: Machine-learning-based district estimates.
- Data limitation: Model-based estimates, not directly observed district life expectancy.
District-Level Human Development Index (HDI) in Pakistan
A district-level assessment of human development across Pakistan, combining three dimensions: health, education and standard of living. The maps show how these dimensions vary geographically and where development disparities are most pronounced.
- Human development is generally higher across Punjab, while several districts in Sindh and Balochistan show lower levels.
- Education and income indicators reveal significant geographic inequalities, with stronger outcomes concentrated in northern and central Punjab and major urban centres.
- The combined HDI highlights districts facing multiple development disadvantages, helping identify areas where coordinated investments in health, education and economic opportunities may be needed.
- Data limitation: Dependent on underlying indicator coverage and estimation methods.
GIS Field Data Collection & Verification
We combine field data collection with geographic verification to improve the accuracy, usability and spatial integrity of real-world datasets.
Faisalabad Survey Zones
Final sample: three zones with 85 households and 7 commercial units each. This map shows 247 households (8 hidden), and the data files are unchanged.
Background: Esri satellite.
Population Estimates
We produce fine-scale population estimates that help reveal where people live and support more precise planning and resource allocation.
Population Estimates for Pakistan at 1 km Resolution
An interactive national population map produced with the same automated workflow, drawn at 1 km resolution so the whole country can be viewed in one file. Population figures are still summed from the full-resolution grid for each administrative area.
Urban Heat & Solar Potential
We analyse land-surface temperature and built-environment characteristics to identify heat exposure and opportunities for solar-energy planning.
Project title
Add featured project description here.
Conversational GIS — Ask the Map
We make spatial information easier to explore by allowing users to ask questions and interact directly with geographic data.
Project title
Add featured project description here.